
Bring your slip.
Start with the picks you’re considering. Review the teams, markets, lines, and odds before requesting analysis.
THE PRODUCT
Bring your slip to the Doctor. See the research behind each decision, the gaps in the evidence, and one clear Grade you can revisit.
Explore plansA SMARTER WAY TO REVIEW A SLIP
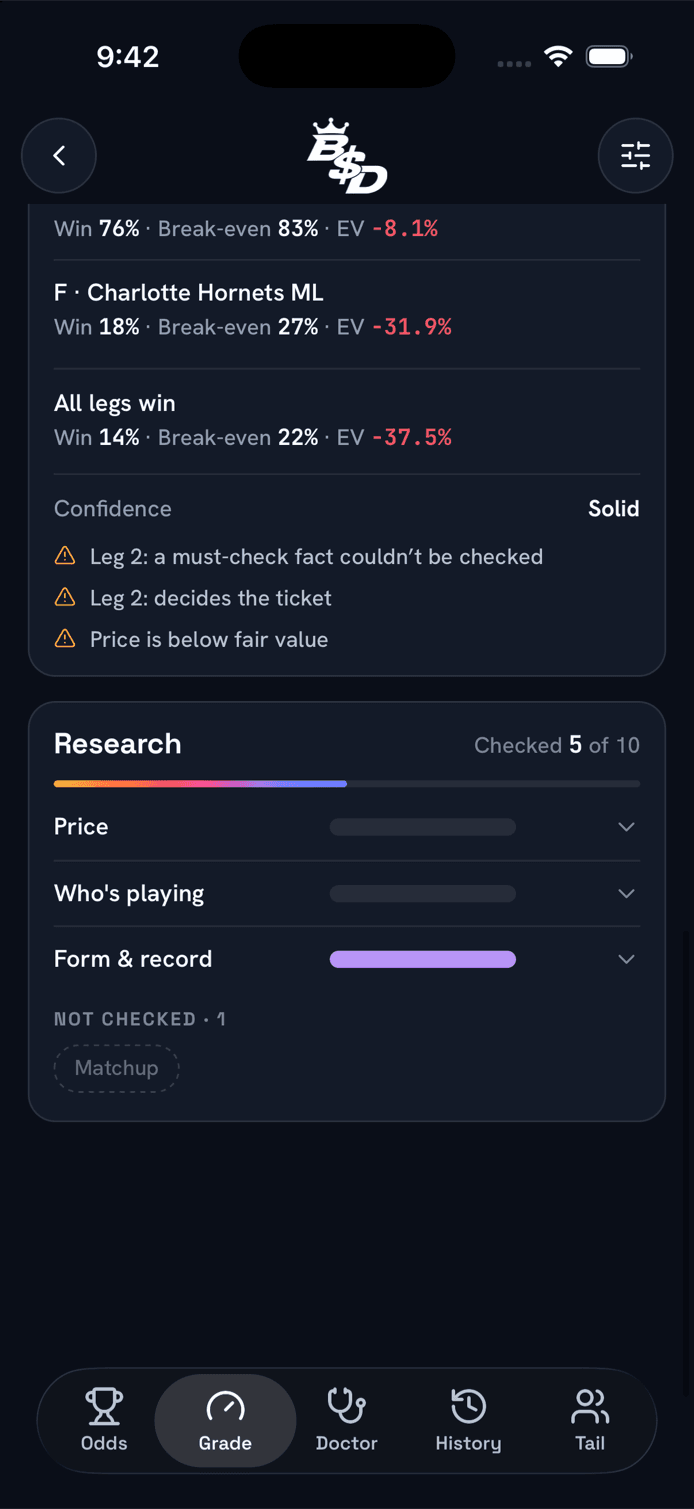
Examine participation, historical results, matchups, conditions, and other research groups. Read the sources, understand the risk, and make your own call.
Start with the picks you’re considering. Review the teams, markets, lines, and odds before requesting analysis.
Read the research, follow the sources, and see where information is missing. A diagnosis can be inconclusive.
Revisit saved analysis on a bigger screen. Your research stays attached to your account, wherever you work.
THE RESEARCH MAP
Every Grade follows the same research map. Some evidence may be unavailable for a particular slip; the report shows those limits instead of filling gaps with certainty.
THE GRADE, EXPLAINED
A saved Grade keeps the sourced findings and missing evidence together.
Find your plan